MEV - Software Development PartnerMEV - Software Development Partner

Services

Services
Product Engineering
Software Product DevelopmentModernization & Legacy Repair
AI Engineering
AI Development ServicesАgentic AI Orchestration
Run & Operate
Application Maintenance & SupportDevOps & Cloud Operations
Audit & Due Diligence
M&A Technical Due DiligencePre-Deal Software AuditSoftware Health Check
Discover All

Industries

Industries
Life Science
HealthcareHealthcare Data Management
Real Estate

AdTech

Programmatic Advertising
Portfolio

About Us

About Us
BlogCareer
Team Integration Workbook: Practical Playbook To Plug External Teams Into Your Delivery System
Contact Us
Contact UsContact Us
Services
Product Engineering
Software Product DevelopmentModernization & Legacy Repair 
AI Engineering
AI Development ServicesАgentic AI Orchestration
Run & Operate
Application Maintenance & SupportDevOps & Cloud Operations
Audit & Due Diligence
M&A Technical Due DiligencePre-Deal Software AuditSoftware Health Check
Discover All
Industries
Life Science
HealthcareHealthcare Data Management
Real Estate
AdTech
Programmatic Advertising
Portfolio
About Us
BlogCareer
Contact Us
Back to Blog
September 23, 2025

The Cost of IT Downtime in 2025: What SMBs Need to Know

...
...
Share:

Downtime used to be considered an IT problem. Something for the tech team to sort out. But in 2025, that framing doesn’t hold. When software fails, the business takes the hit—immediately and across the board.

Operations stall. Revenue slips. Customer trust erodes. In regulated industries, compliance risk increases. None of that is a technical detail. It’s a board-level concern.

For small and midsize businesses, the impact is often worse. They rarely have dedicated support teams, formal escalation processes, or mirrored infrastructure. Many run on legacy systems with limited documentation and rely on part-time contractors or one-person IT setups. When something breaks, there’s often no clear owner—and no quick fix.

And it’s happening more often. A few years ago, over 76% of organizations experienced downtime or data loss.This raises the real question: how much does downtime cost your business in 2025? Let's break that down.

Real Numbers: What Downtime Actually Costs SMBs

Downtime is one of the most underestimated financial risks. It doesn’t usually show up in budget planning—but when it hits, it hits hard. For SMBs, the cost of downtime per minute can escalate quickly.

How Much Does One Hour of Downtime Cost?

Let’s start with the broad view:

  • 90% of firms say an hour of downtime costs them over $300,000
  • 41% of enterprises report hourly downtime costs between $1 million and $5 million
  • Even among SMBs (20–100 employees), 57% say an hour of downtime costs up to $100,000

If you’re a micro SMB (e.g., <25 employees), that still translates to $1,670 per minute or $100,000 per hour—and that’s considered conservative.

For larger companies:

  • $16,700 per minute is standard when 10+ servers and core applications are affected
  • The average across industries has reached $5,600 per minute (or ~$336,000/hour)

This isn't theoretical. These numbers are not hypothetical. This is real, quantifiable business downtime cost —and it applies to anyone running production systems without robust support structures.

Cost by Industry (Per Hour)

Some sectors feel the impact of downtime more acutely than others. Below are benchmarks for business downtime costs by industry based on real-world data.

Hourly Cost of Downtime by Industry

Industry Hourly Downtime Cost
Healthcare $636,000
Retail & E-Commerce $1.1 million
Media $90,000
Telecommunications $2 million
Energy $2.48 million
Automotive $3 million
Brokerage/Trading $6.48 million
Manufacturing (avg) $260,000
IT (general average) $145,000 – $450,000

In the automotive sector, downtime can exceed $50,000 per minute, or $3 million per hour, due to stopped production lines and delayed deliveries. In manufacturing, businesses face an average of 800 hours of downtime per year, costing $260,000 per hour.

In healthcare and finance, the stakes include not just lost revenue—but regulatory penalties, patient safety, and litigation.

What Happens After Systems Go Down

The Hidden Ripple Effects of Downtime

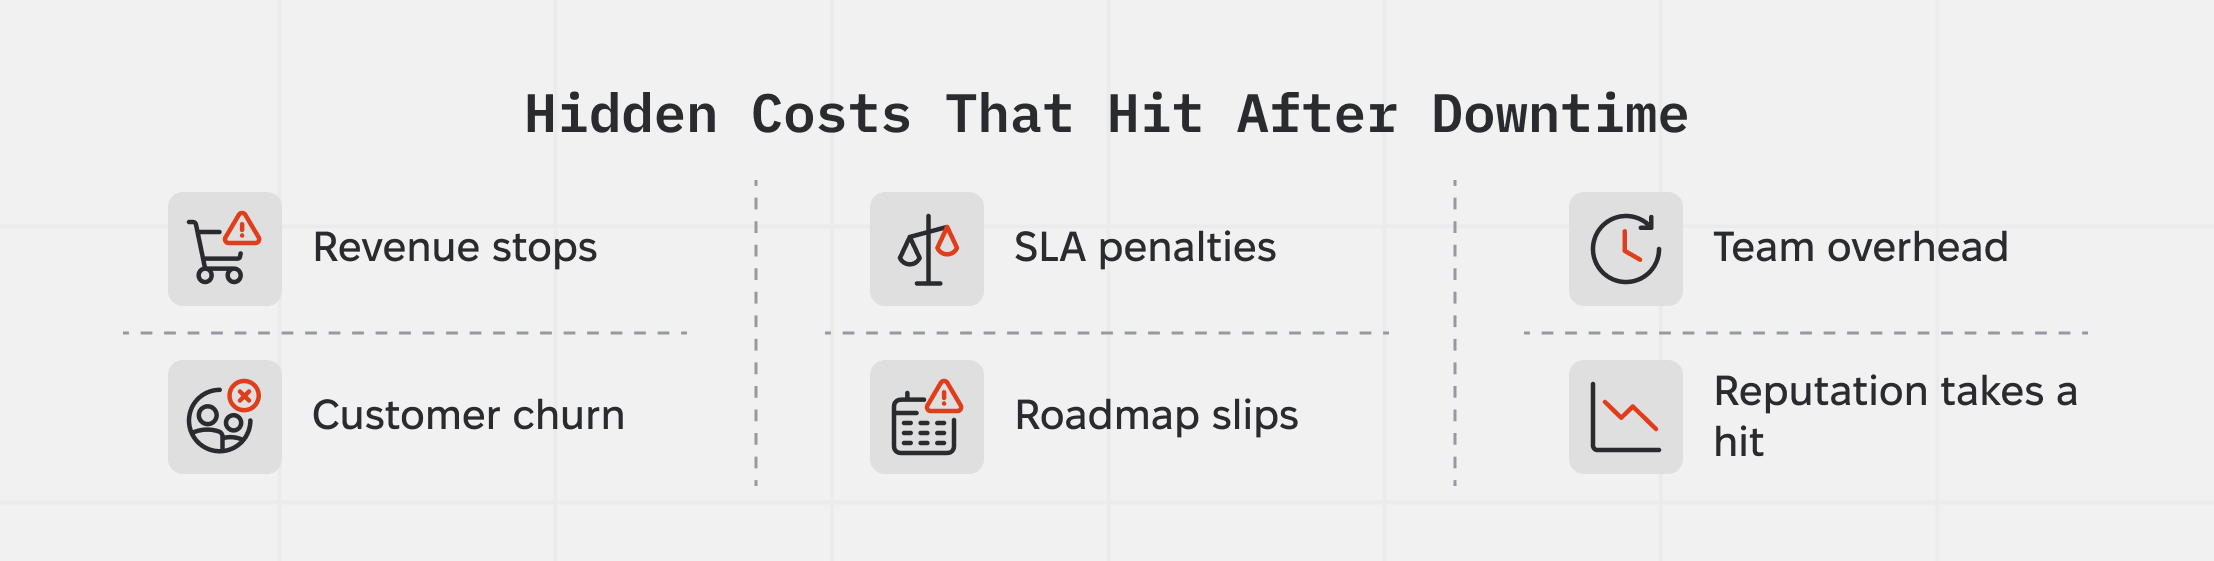
Downtime isn’t a single problem—it creates six. Most companies track the immediate cause, fix it, and move on. But the real costs show up later: in missed targets, burned teams, and lost customers.

Here’s what happens after systems go down:

  1. Revenue stops – Orders, payments, and transactions pause. No system, no cash flow.
  2. SLA penalties – If you promised uptime, expect credits, discounts, or legal tension.
  3. Team overhead – Your best people drop their work to triage, debug, and clean up.
  4. Customer churn – Every hour offline costs you users. Some don’t come back.
  5. Roadmap slips – Recovery eats into roadmap time. Releases get pushed.
  6. Reputation takes a hit – You get labeled as unreliable. It sticks.

If you're not tracking these ripple effects, you're underestimating the business cost of outages.

Downtime Impact — What to Track & How to Respond

Category What to Track What It Impacts How to Respond
1. Revenue Loss
  • Blocked orders
  • Failed checkouts
  • Halted billing runs
  • Daily revenue
  • Quarterly performance
  • Calculate cost per minute/hour for revenue-critical systems
  • Set up rollback paths
2. SLA Penalties
  • SLA breach incidents
  • Refund/credit totals
  • Compliance flags
  • Client trust
  • Renewal terms
  • Legal exposure
  • Log every breach; tag by contract
  • Review SLA clauses in client-facing agreements
3. Team Disruption
  • Overtime hours
  • Roadmap slippage
  • Recovery cycles in sprint planning
  • Delivery velocity
  • Team morale
  • Burnout risk
  • Track incident hours vs planned work
  • Cap emergency time
  • Pre-allocate buffer
4. Customer Churn
  • Drop in usage post-incident
  • Increase in support tickets
  • NPS/CSAT drop-offs
  • ARR
  • Churn rate
  • Customer success KPIs
  • Connect outage windows to churn data
  • Communicate early
  • Add uptime to onboarding
5. Roadmap Impact
  • Post-incident recovery tasks
  • Skipped features
  • Reactive bugfix releases
  • Product momentum
  • Predictability
  • Stakeholder trust
  • Budget 10–15% of roadmap for maintenance debt
  • Don’t pull from roadmap last minute
6. Reputation Damage
  • Prospect questions in sales calls
  • Churned deals citing reliability
  • RFP losses
  • Brand credibility
  • Pipeline velocity
  • Track mentions in sales/renewal conversations
  • Include uptime stats in client materials

Implementation Tips

  • Use this table in post-mortems: Go beyond root cause. Ask what each column cost you.
  • Turn rows into OKRs: Assign ownership across engineering, product, support, and customer success.
  • Run quarterly downtime impact audits: This builds the case for preventative investment—without waiting for the next crisis.

5 Common Downtime Triggers in SMB Environments

Most outages don’t start with a crash. They start earlier—with patchy handoffs, aging systems, and missing safeguards.

Take the codebase. Over time, it fills with fragments no one owns. Scripts with unclear purposes. API calls no one remembers writing. When things break, you waste hours figuring out what you're even looking at.

Then there’s legacy software—critical systems everyone’s afraid to touch. They're fragile, undocumented, and usually built by someone long gone. Teams avoid them until they fail under pressure or during routine maintenance.

Even in modern stacks, updates often go live without rollback plans. When something breaks, recovery becomes trial-and-error. Meanwhile, the system stays down, and customers start to notice.

Many systems also rely on third-party services—payments, email, auth—but no one monitors them. If a vendor fails, you fail too. And without alerts or fallback logic, you hear about it from users first.

And finally, support is often scattered. Freelancers, agencies, and internal staff each own a piece of the puzzle. But when something goes wrong, no one has full visibility—or accountability.

These aren’t edge cases. They’re routine. And they’re exactly where most preventable downtime begins.

Each of these creates friction during recovery—and increases the chance of outages in the first place.

Downtime Triggers — Causes, Symptoms & Actions

Trigger How It Causes Downtime Symptoms You’ll See What to Do About It
1. Ghost Code & Poor Documentation Code runs in production but lacks comments, ownership, or revision history Fixes take hours; support team waits on answers; same issues resurface
  • Tag code ownership in Git
  • Require inline documentation
  • Run quarterly code reviews for “unknown” areas
2. Legacy Systems Nobody Owns Older systems break under load or after environment changes; no one wants to update them Teams avoid updates; infrastructure drift; “do not touch” zones in architecture
  • Create a legacy inventory
  • Assess business risk per system
  • Isolate legacy modules or wrap them in containers
3. No Rollback Plan on Updates Deployments fail but can’t be reversed without manual, high-risk intervention Systems stay broken for hours post-release; rollback attempts cause new bugs
  • Add rollback steps to release checklists
  • Snapshot systems before deployment
  • Use versioned infrastructure config
4. Unmonitored 3rd-Party Dependencies APIs, DNS, auth, billing services fail—and your app doesn’t handle the disruption Partial outages; errors in key user flows; “it’s their fault” explanations
  • Maintain a dependency list
  • Monitor external service status
  • Add basic failover logic and retries in integrations
5. Fragmented Support Between Vendors/Freelancers No one has full system context or shared access to respond quickly Blame-shifting; slow incident response; gaps in coverage during handoffs
  • Centralize credentials and logs
  • Define clear escalation paths
  • Standardize tooling across internal and external teams

Implementation Guidance:

  • Use this table in a quarterly system health review or as part of onboarding a new tech lead.
  • Each “What to Do” action is designed to be implementable with minimal resources—no major platform shifts required.
  • These patterns also double as root cause audit checkpoints when downtime occurs.

Checklist: Are You at Risk of a Business-Crashing Outage?

Use this as a quick self-audit. If you check more than a few boxes, your business is likely carrying silent operational risk—and it's just a matter of time before it turns into a visible outage.

Business-Crashing Outage Assessment

Checklist: Are You at Risk of a Business-Crashing Outage?

✅ SYSTEM VISIBILITY & OWNERSHIP

✅ INFRASTRUCTURE & DEPLOYMENT SAFETY

✅ SUPPORT & INCIDENT RESPONSE

✅ BUSINESS IMPACT & RISK ALIGNMENT

Your Assessment Result:

Closing: It’s Time to Treat Downtime Like a Strategic Risk

The cost of IT downtime in 2025 is a hard number. And for many SMBs, it’s hiding in plain sight.

The companies that stay resilient do three things:

  1. Quantify what a minute of downtime costs them
  2. Map their weakest points and operational gaps
  3. Shift investment toward prevention—not just resolution

Support and maintenance aren’t cost centers. They’re insurance against revenue loss, customer churn, and team burnout.

If you’re still firefighting incidents, running on legacy code, or struggling with visibility—you’re not alone. But the path forward is clear: build systems that are monitorable, maintainable, and resilient by design.

That’s how you reduce downtime costs—and keep your business moving when it matters most.

FAQ: Cost of IT Downtime, Outages, and Downtime Prevention

Downtime cost is the total financial impact when your systems, servers, or applications are unavailable.

A simple estimate most teams use:

Downtime cost = minutes of outage × cost per minute

Your cost per minute should include lost revenue, productivity loss, extra support and recovery effort, SLA penalties, and reputational impact. Once you know roughly how much you earn per hour and how many people or processes depend on the affected systems, you can turn an incident duration into a concrete number quickly.

Across industries, the average cost of downtime per hour routinely lands in the six-figure range. Recent surveys show that over 90% of mid-size and large enterprises say one hour of IT downtime costs more than $300,000, and 41% put it between $1 million and $5 million per hour.

SMBs may see smaller absolute numbers, but the impact on cash flow and growth is often worse. Losing $25,000–$100,000 in a single hour of shutdown can wipe out an entire month’s margin for a small team. In practice, the true cost is often best measured as a percentage of revenue and runway, not just raw dollars.

A classic benchmark often cited is about $5,600 per minute, or roughly $336,000 per hour.

More recent 2024–2025 studies show that number trending upward for data-intensive firms, with some large enterprises reporting $10,000–$14,000+ per minute when core platforms fail.

For smaller organizations, a conservative starting point is a few hundred to a few thousand dollars per minute. The safest approach is to calculate your own cost per minute using your revenue, staffing, and critical process data rather than relying only on global averages.

Server downtime or data center downtime compounds quickly because it often hits several applications at once.

If you run a SaaS product or digital platform, one failed storage array, virtualization host, or network switch can block thousands of users simultaneously. In practice, lost MRR, refund requests, SLA credits, and overtime for your ops team often show up on the same incident report.

Unplanned system outages are far more expensive than scheduled maintenance windows. During an unexpected outage, you’re paying for:

  • 100% loss of online revenue for affected services
  • Emergency engineering time and overtime
  • Contractual penalties and SLA credits
  • Customer churn and reputational damage

Planned maintenance can be scheduled at low-traffic hours, communicated in advance, and tightly time-boxed. You may see a temporary dip, but you avoid panic, support spikes, and most compliance risk.

Downtime costs vary sharply by sector. Recent benchmark ranges often cited include:

  • Healthcare: ≈ $636,000 per hour
  • Retail and e-commerce: ≈ $1.1 million per hour
  • Media: ≈ $90,000 per hour
  • Telecommunications: ≈ $2 million per hour
  • Energy: ≈ $2.48 million per hour
  • Automotive: ≈ $3 million per hour (about $50,000 per minute)
  • Manufacturing average: ≈ $260,000 per hour, with 800+ downtime hours per year often cited
  • IT and digital services: typically $145,000–$450,000+ per hour, depending on scale

These are useful reference points when you build your own business case for better monitoring, redundancy, and support.

For manufacturing in 2025, a single hour of unexpected downtime is often estimated between $50,000 and $260,000, with many plants reporting 800+ hours of unplanned downtime per year.

In automotive assembly, multiple sources commonly peg assembly line downtime at roughly $22,000–$50,000 per minute, or $2.3–$3 million per hour, once you factor in idled labor, missed delivery windows, and cascading supply-chain penalties.

For semiconductor fabs, public estimates often hover around $1 million per hour of lost production.

For online businesses and custom e-commerce platforms, website or application downtime usually means 100% loss of digital revenue for the duration of the outage.

For SMBs, a 30-minute outage during peak hours can translate into thousands or tens of thousands in lost orders, plus refunds or discounts to reduce churn. If the storefront is heavily customized and carries technical debt, recovery tends to take longer, so losses compound over time.

Network downtime shuts off everything that relies on connectivity: VPN, VoIP, collaboration tools, POS terminals, IoT devices, APIs, and cloud apps.

Beyond direct revenue loss, communication downtime has hidden financial costs: slower incident triage, misrouted customer support, and internal teams acting on outdated information. Major outages can also drive churn and long-term reputation damage.

Lost revenue is the obvious one, but these are usually the real multipliers:

  • Idle payroll: staff who cannot do productive work while systems are down
  • Overtime for recovery: engineers and support pulled into late-night or weekend work
  • SLA and contractual penalties: credits, refunds, and legal exposure
  • Operational backlog: delayed orders, filings, or internal projects
  • Brand damage and churn: lower NPS and customers switching providers quietly

Even small uptime differences can change ROI dramatically:

  • 99.0% uptime ≈ 3.65 days of downtime per year
  • 99.9% uptime ≈ 8.76 hours per year
  • 99.99% uptime ≈ 52 minutes per year

If your cost per minute is in the hundreds or thousands, moving from 99.0% to 99.9% (or better) can mean hundreds of thousands saved annually, often more than the cost of higher-tier infrastructure, redundancy, or DR.

Even in smaller environments, it is common to see multiple outages per month, with total annual downtime often in the tens of hours for critical systems.

A practical target for SMBs is to push core business systems toward 99.9%+ uptime and treat recurring monthly incidents as a signal that you need better monitoring, stronger support processes, or a change in hosting or architecture.

Pricing spans a wide range, but common budget patterns look like this:

  • Entry-level DR for small environments: low four figures per month
  • Mid-market fully managed DR across multiple apps and regions: low- to mid-five figures per month
  • Large enterprises: six figures per year or more, especially with strict RTO/RPO and compliance

The key question is: what is your downtime cost per hour, and how much of that are you willing to risk. A DR plan that prevents even one serious outage a year often pays for itself several times over.

Cheap SMB hosting often comes with weaker uptime SLAs, shared infrastructure, and slower incident response. Even if you save a few hundred dollars a month, one or two major outages can erase those savings instantly.

Compare uptime, support model, and recovery guarantees next to monthly price. For customer-facing systems, it is usually more cost-effective to choose 99.9%+ SLAs, transparent incident processes, and active monitoring rather than chasing the lowest sticker price.

For SMBs, every serious incident is an unplanned tax on growth. Under-funded support, monitoring, and maintenance become a hidden liability.

Even modest improvements in uptime can unlock meaningful ROI, often in the first year. Investing in monitoring, predictable on-call processes, application support, and disaster recovery turns downtime from a vague risk into a managed cost with numbers you can actually show to finance leadership.

MEV team
Software development company

Related Articles

November 27, 2025

The 7 Maintainability Checks to Keep Your Application Healthy

All
All
Application Maintenance & Support Services
This is some text inside of a div block.
September 22, 2025

Software Change Management for Support Teams: Tracking What Matters

All
All
Application Maintenance & Support Services
This is some text inside of a div block.
September 10, 2025

Predictive Application and Software Maintenance & Technical Debt Forecasting

All
All
Application Maintenance & Support Services
This is some text inside of a div block.
Read more articles

Related Articles

February 20, 2026

What 2025–2026 Data Reveal about the Agentic AI Market

All
All
AI
This is some text inside of a div block.
January 23, 2026

How Healthcare Platforms Should Choose FHIR Infrastructure

All
All
healthcare
This is some text inside of a div block.
Infrastructure
This is some text inside of a div block.
January 22, 2026

Agentic AI in Production: Workflows, Orchestration, Guardrails, Observability

All
All
No items found.
Read more articles
Get Your Free Technology DD Checklist
Just share your email to download it for free!
Thank you!
Your free Technology DD checklist is ready for download now.
Open the Сhecklist
Oops! Something went wrong while submitting the form.
MEV company
Contact us
212-933-9921solutions@mev.com
Location
1212 Broadway Plaza, 2nd floor, Walnut Creek, CA
Socials
FacebookInstagramX
Linkedin
Explore
Services
PortfolioBlogCareerContactPrivacy Policy
Services
Software Product Development
Product Development AccelerationApplication Maintenance & Support Innovation Lab as a ServiceM&A Technical Due DiligencePre-Deal Software Audit and OptimizationSoftware HealthcheckAI Development ServicesАgentic AI OrchestrationDigital TransformationLegacy Repair ServiceDevOps & Cloud OperationsFractional CTO Service
Industries
Life ScienceHealthcareHealthcare Data ManagementPropTech & Real Estate
AdTech
Programmatic Advertising
Collaboration models
Augmented StaffIntegrated TeamDedicated Team
© 2025 - All Rights Reserved.

We use cookies to bring best personalized experience for you. Check our Privacy Policy to learn more about how we process your personal data

Accept All
Preferences

Privacy is important to us, so you have the option of disabling certain types of storage that may not be necessary for the basic functioning of the website. Blocking categories may impact your experience on the website. More information

Accept all cookies
👉 Book Free Infrastructure Audit by October 31