Home
Portfolio
Daiichi-Sankyo
Daiichi-Sankyo
Daiichi-Sankyo

Daiichi Sankyo Accelerates Sales Execution with a Custom Data Analytics Platform Built by MEV

Unified 16 third-party data sources
Integrated multiple paid systems to deliver actionable insights and higher data efficiency.
Improved Sales Execution Speed
Reps gained instant access to key market data in their 60–90-second window.
Compliance Control
Compliance Control
FDA-approved algorithms ensured only current, verified data reached physicians.
Daiichi Sankyo Accelerates Sales Execution with a Custom Data Analytics Platform Built by MEV
Industry
Life Sciences
Pharmaceuticals
Biopharmaceuticals
Provided Services
Healthcare Data Management SolutionsHealthcare Software Development
Custom Software Development
UX/UI Design
Tech Stack
Python / PHP /  MongoDB / Hadoop / PostgreSQL / Rabbit MQ / Sencha Apache
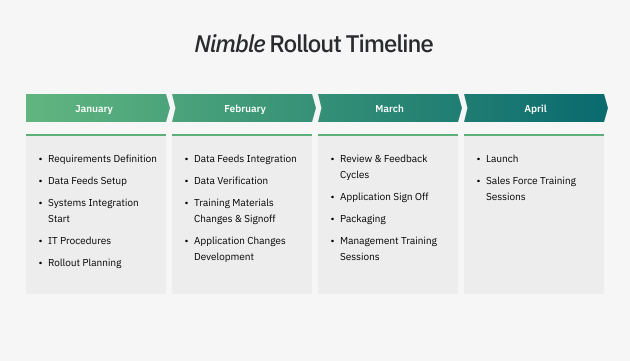
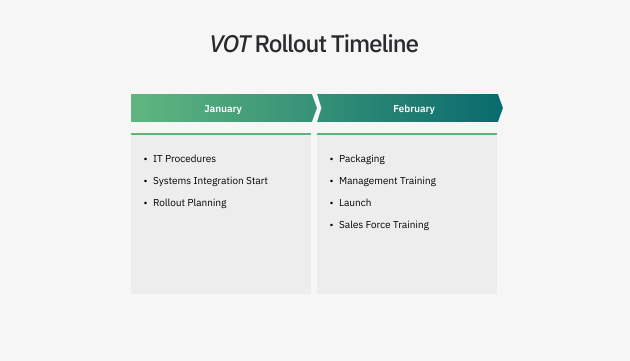
Project Rollout Timeline
4-month rollout from requirements definition to launch

[ client & product overview/ ]

Daiichi Sankyo is a global pharmaceutical company headquartered in Japan, with a presence in 24 countries.

When launching a new cardiovascular drug in the U.S., they needed processing mountains of market data to meet demanding sales constraints. The challenge was to turn data into clear, actionable sales messages reps could actually use in 90-second HCP meetings.

MEV created two software solutions that made visualization and analysis fast and easy and sales message delivery effective.

Executive Summary

MEV partnered with Daiichi Sankyo to design and build a custom data analytics platform that unified 16 external data sources into one ecosystem supporting sales, marketing, and account management. The solution included a data integration and visualization platform, and a field application with instant access to relevant, localized market data.

With these tools, Daiichi Sankyo shifted from fragmented, slow analysis to a unified, field-driven data strategy.
How They Use the Solution
E1:
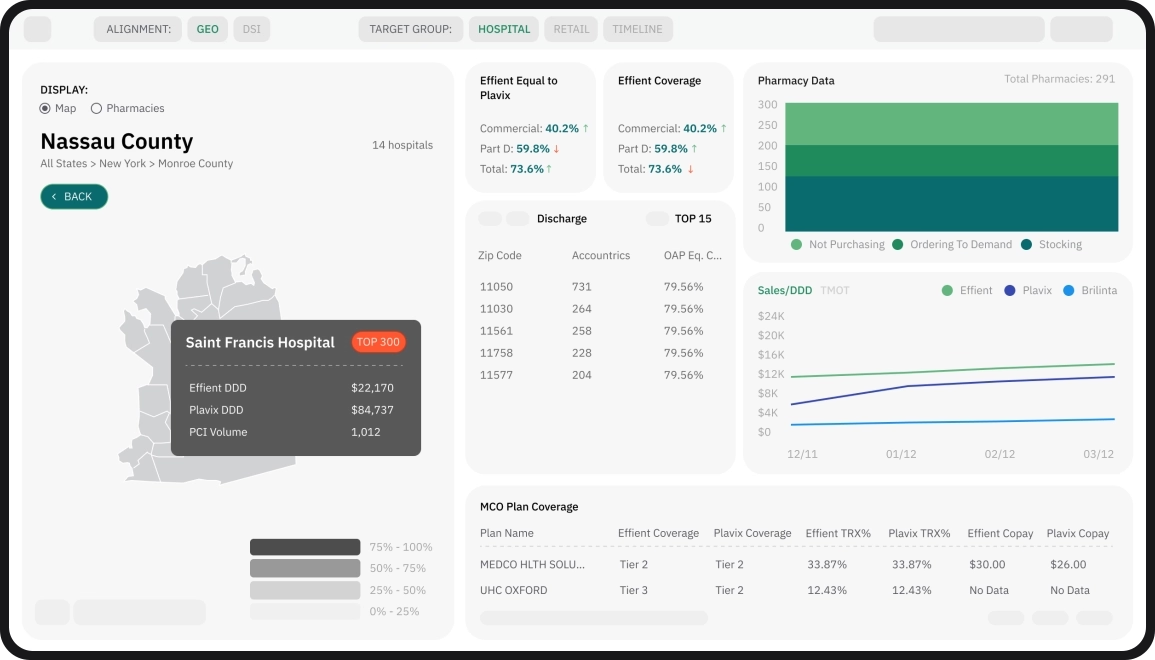
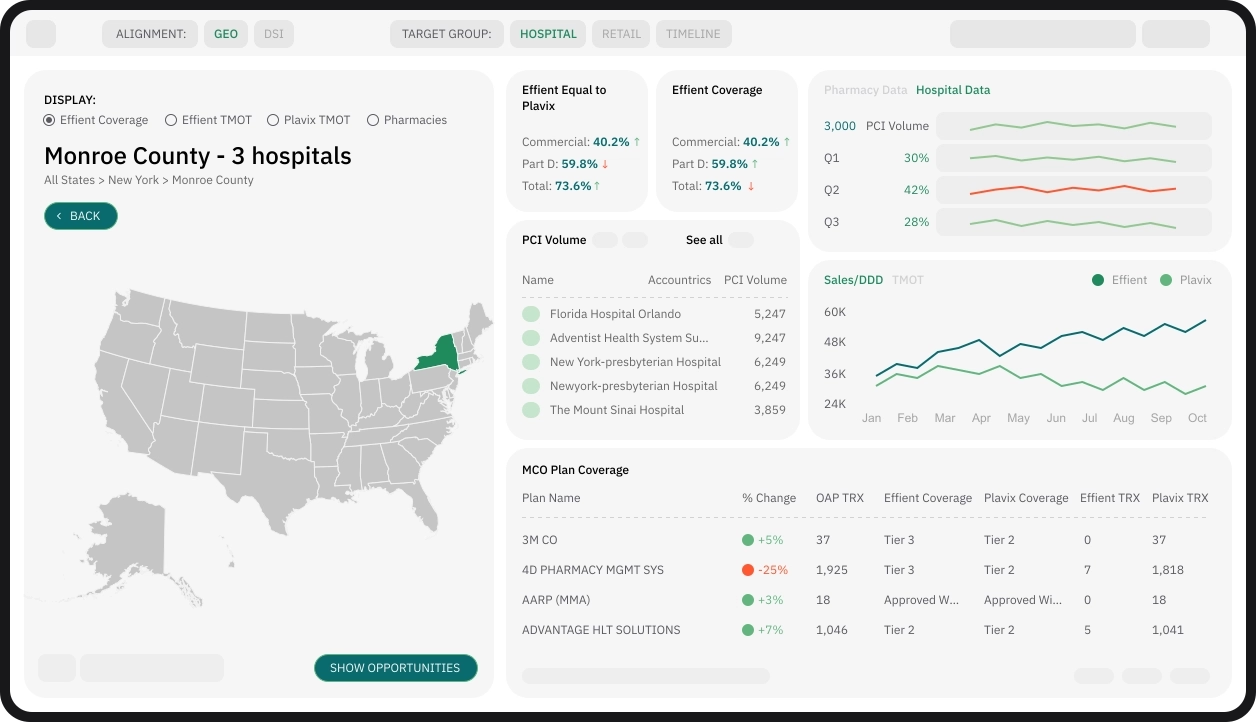
Business analysts and sales leadership use NimbleTool to understand national and regional performance, payer dynamics, and opportunities.
E2:
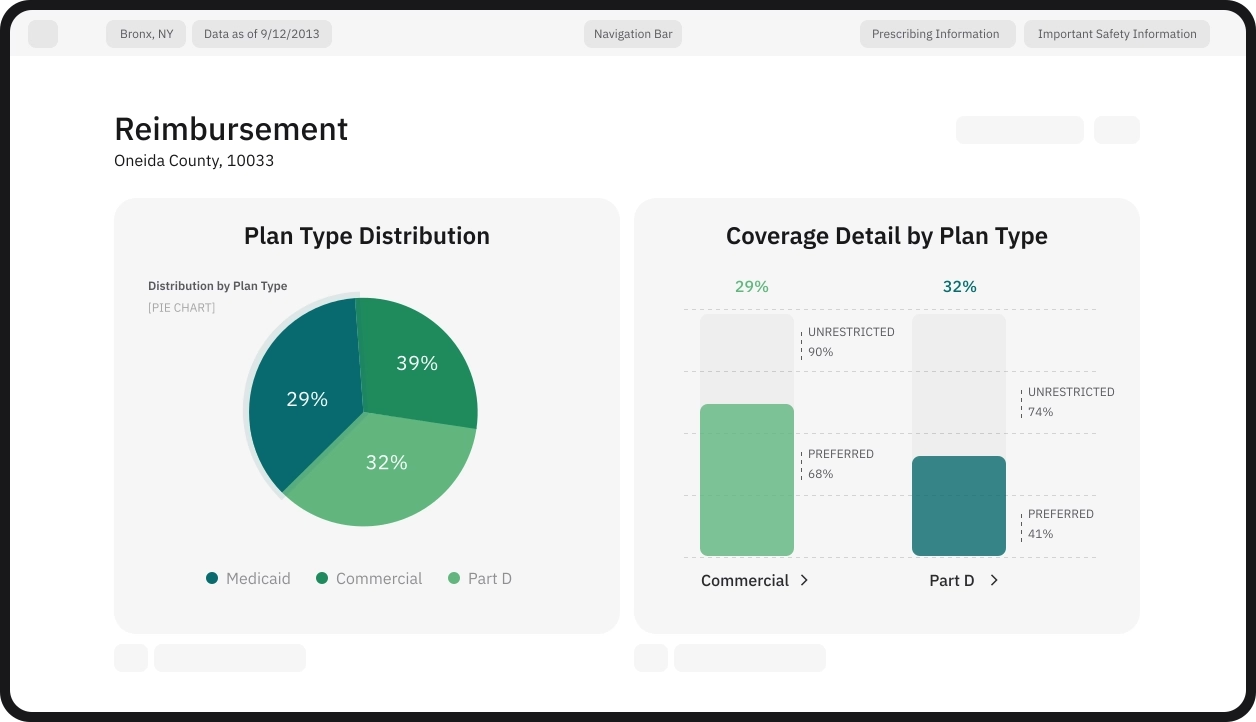
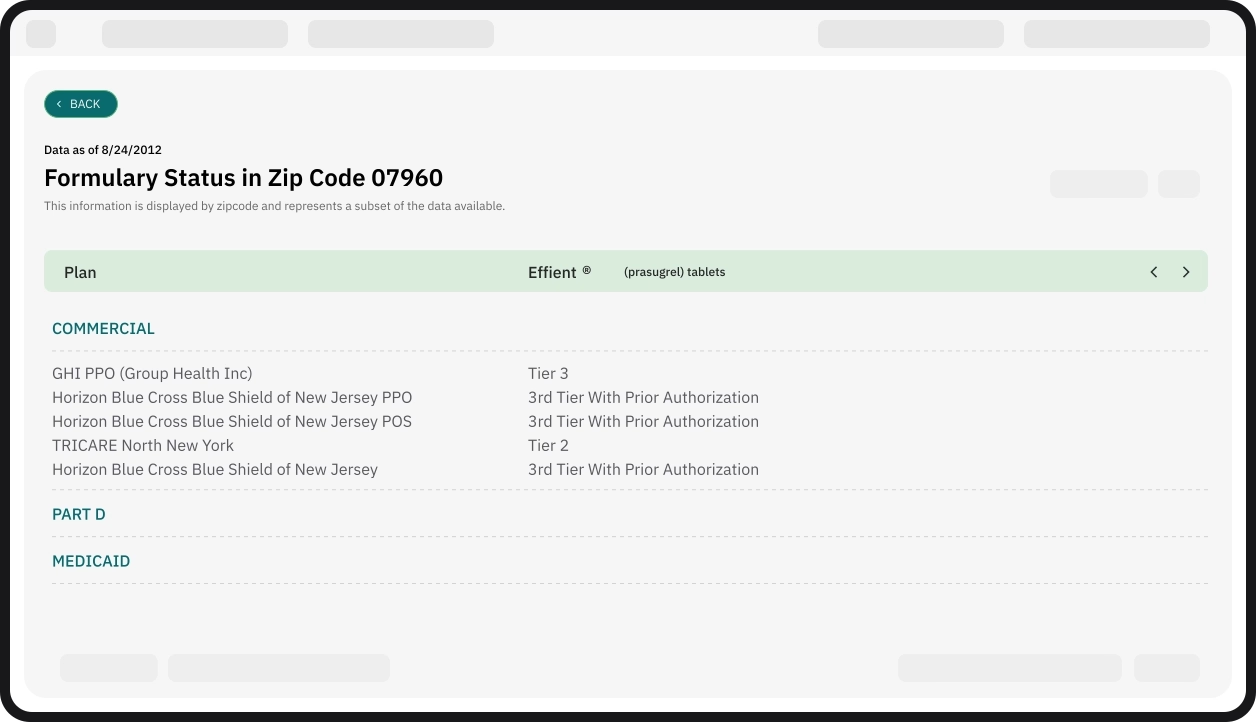
Field reps use the VOT iPad application in real time with HCPs to show local formulary coverage, cost information, and competitive status in a way physicians find clear and engaging.
E3:
The organization continuously updates data and tracks usage to ensure relevance and ROI.

[ challenges/ ]

The Core Challenges Solved

Daiichi Sankyo needed instant access to accurate, relevant information — yet the company’s data landscape made that difficult.
C1:

Too much data, not enough insight

The company subscribed to multiple industry-standard, expensive data and analytics sources. However, these weren’t being used to their full potential, raising concerns about losing competitive ground.
C2:

Siloed data across departments

Different sets of market data were owned and processed in separate departments. Siloing and sheer volume caused delays: by the time business analysts processed the data, the market conditions often shifted.
C3:

Slow internal communication and decision-making

Communication gaps between business and technical teams made it hard to quickly convert raw data into actionable guidance for field reps.
C4:

Previous development attempts had failed

Daiichi Sankyo had engaged multiple development vendors but none delivered a working solution. There was a persistent lack of alignment between the business vision (faster, smarter sales decisions) and a feasible technical roadmap.

[ how we did it/ ]

Solution & Implementation
S1:
MEV began with a discovery phase focused on understanding how sales reps actually worked in the field. We engaged directly with stakeholders across commercial operations, analytics, IT, and sales leadership to identify real operational friction points.
S2:
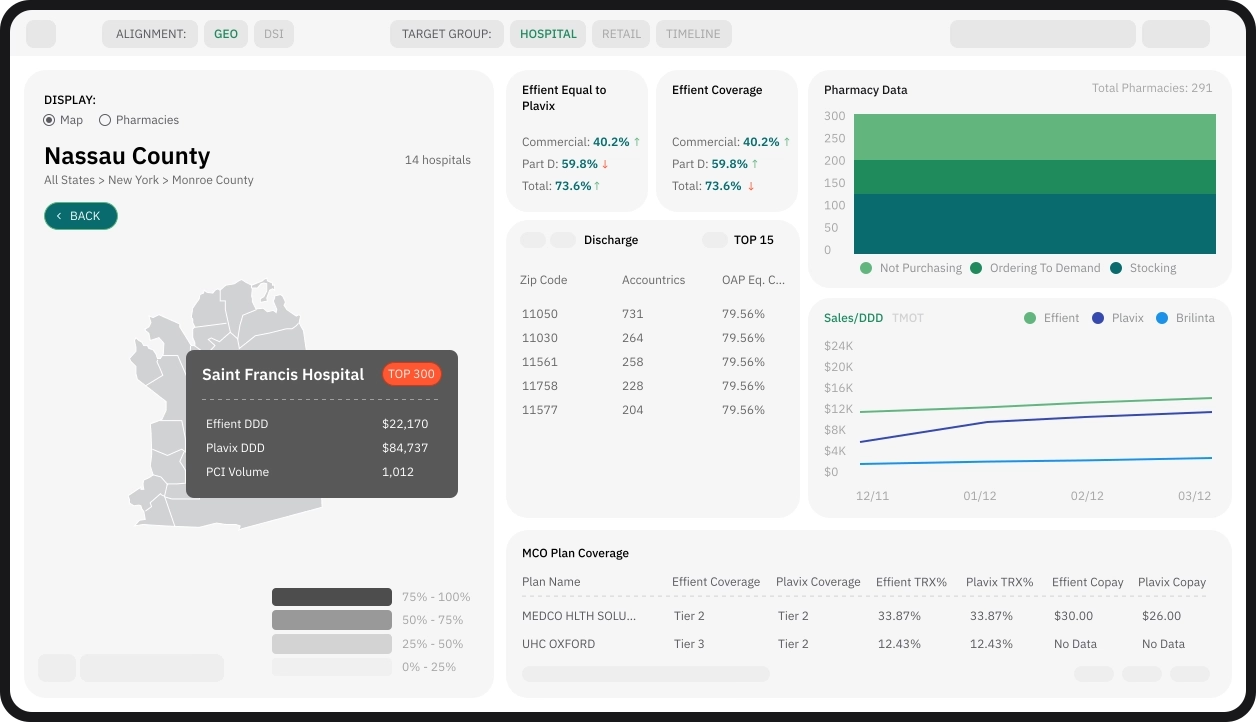
NimbleTool – Data & Analytics Platform integrating 16 external proprietary data sources with filters for salespeople to observe different data sets at any level — territory, district, region or area.
  • Unified multiple data sources into one platform (included information as  MC access, Competitive access, Pharmacy stocking, Reimbursement Environment, Hospital discharge)
  • Provided granular filtering (zip → national, territory → region)
  • Presented dashboards and views that “tell a story” about sales performance and market dynamics rather than showing disconnected reports
  • Improved strategic planning by highlighting major payers, hospitals, performance, and pull-through opportunities
S3:
Value Optimizer Tool VOT - An interactive open platform application to aid sales representatives in demonstrating the value of branded pharmaceutical products to HCPs.
  • iPad application with offline capability for use during sales calls
  • Backend system to process hyper-targeted data by zip code
  • Surfaced information relevant to local physicians, including cost mitigation, clinical efficiency, insurance coverage, pharmacy stocking, and reimbursement environment
  • Ensured better FDA compliance by selecting plans via an approved algorithm and preventing outdated material from being used
S4:
Following development, MEV ran a pilot and UX testing program with physicians and a group of field reps.
  • 21 of 24 physicians (88%) reported highly favorable perceptions of VOT, praising its ability to show precise, physician-specific formulary and cost data.
  • 19 of 24 (79%) said the tool would directly influence how they select medications, citing better clarity on coverage and real pricing.
  • Reps described the app as an “ideal tool” to overcome one of their biggest barriers — cost-related objections from HCPs.
Pilot Group Feedback
Doctors liked iPad communication much better than paper
This will help to clear up a lot of confusion for my offices
Being able to show real cost and savings numbers instantly makes the discussion more credible.
Best thing this company has done in a while
This is the first tool that actually helps me handle the cost conversation. I can walk in, pull up the exact plan, and get straight to the point.
Awesome, just awesome
Not only I was able to communicate formulary better, my HCP got much more engaged asking me to try different zip codes and show him other areas

[ results/ ]

The source materials describe qualitative, not numeric, outcomes:
R1:
Faster, more effective sales conversations enabled by improved UX and highly relevant data delivery.
R2:
Improved internal communication, as key stakeholders now accessed the same integrated market view instead of disconnected reports.
R3:
Better interpretation of multiple data sources, made actionable and aligned with the needs of the field sales force.

Key Use Cases

K1:

Strategic territory planning with NimbleTool

Stakeholders identify major payers and hospitals in each geography, track their performance, and find pull-through opportunities by correlating hospital performance with managed care formulary decisions.
K2:

Compliance-safe, up-to-date messaging

VOT ensures plans are selected by an approved algorithm, reducing compliance risk and preventing obsolete information from being shared.
K3:

Local, physician-specific value discussions with VOT

Reps use VOT to show physician-specific formulary coverage, “actual medication cost,” and savings options during a visit. Physicians particularly appreciate the ability to quickly check different zip codes and see coverage nuances.
K4:

Performance monitoring and continuous improvement

The team tracks VOT utilization, data refreshes, and ROI to refine content and workflows over time.

[ portfolio/ ]

Related Case Studies

Preferences

Privacy is important to us, so you have the option of disabling certain types of storage that may not be necessary for the basic functioning of the website. Blocking categories may impact your experience on the website. More information

Accept all cookies